
Mobile ad spending lags behind usage: Six key digital trends from KPCB – StartupSmart

Mobile phone use now accounts for nearly a quarter of the time consumers spend with media, yet mobile accounts for just 8% of ad spending, according to a new report by US Venture Capital firm Kleiner Perkins Caufield & Byers.
The lag between mobile phone use and mobile ad spending was one of the key statistics in KPCB’s 2015 Internet Trends report, which looks at how mobile phones and the internet are fundamentally reshaping how consumers engage with the media.
Here are six major trends identified in the report:
1. Internet and smartphone growth is strong, but slowing
The KPCB report shows that while use of the internet and smartphones continues to grow, the growth rate is slowing compared to previous years.
Currently, around 2.8 billion people use the internet globally. However, the number of new people signing up is slowing. The growth rate was just 8% in 2014, compared to 10% in 2013 and 11% in 2012.
Aside from India, where the number of connected users surged 33%, the growth rate for the internet in most major economies is slowing. It was just 7% in China during 2014, 4% in Brazil, 2% in the USA and flat in Japan.
Similarly the number of smartphones globally reached 2.1 billion in 2014. However, again, the growth rate was slowing, increasing by 23% in 2014, compared to 27% in 2013 and a massive 65% in 2012.
While the growth rate has already slowed in the US (9%) and Japan (5%), it remains much faster in China (21%), India (55%) and Brazil (28%).
2. Mobile phones are now used by 5.2 billion people globally
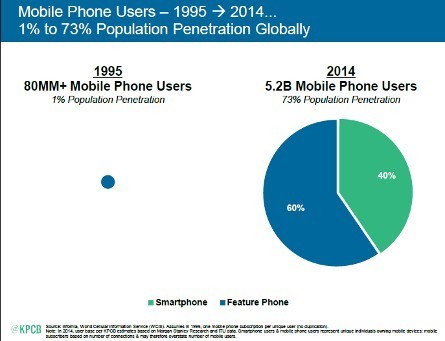
One of the standout trends in the report has been the breathtaking growth in mobile phone use over the past 20 years.
According to the report, just 1% of the world’s population – around 80 million people – owned a mobile phone in 1995.
Since then, the number of mobile phone users has surged to 5.2 billion. Just under three quarters (73%) of the humans alive anywhere on Earth now have a mobile phone of some description.
However, of the world’s mobile phone users, just 40% have made the upgrade to a smartphone, while a remarkable 60% still use feature phones. This suggests there is still a lot more growth to come for the smartphone market globally – especially in emerging markets.
3. More people have mobile phones than internet access
Compared to the 73% penetration rate for mobile phones, only 39% of the world’s population (around 2.8 billion people) have some form of internet access.
The number of people online is fairly evenly spread between Asia excluding China (28%), China (23%), Europe (19%), the US (10%) and the rest of the world (21%).
However, this represents a huge change from just 20 years ago. Back in 1995, there were only around 35 million internet users globally, with 61% in the US, 22% in Europe, 12% in Asia (excluding China) and just 5% in China and the rest of the world.
4. We’re spending more time online than ever before
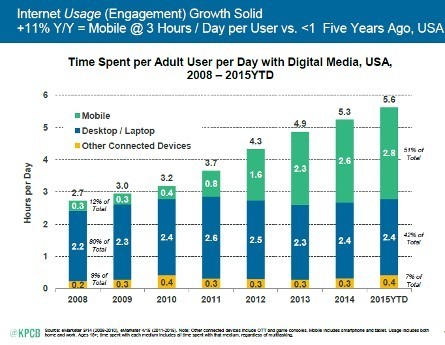
The figures show we’re spending more time than ever before on the internet – and the main device we now use is the mobile phone.
In 2008, the average adult in the US spent an average of just 2.7 hours a day. Most of that time – 2.2 hours per day, or around 80% of all internet use – was conducted from a desktop PC or a laptop.
By contrast, just 12% of internet time on average (0.3 hours) was spent on a mobile phone, and 9% (0.2) was spent on other connected devices.
By contrast, in 2015, the amount of time the average American spends on the internet has nearly doubled to 5.3 hours per day. Most of that time – 51% of all time spent online – is now from a mobile phone.
Interestingly, while the length of time each day people spend access the internet from a desktop or laptop computer has increased slightly to 2.4 hours, the percentage has fallen to just 42% of the total.
5. Ad spending hasn’t caught up with mobile internet use
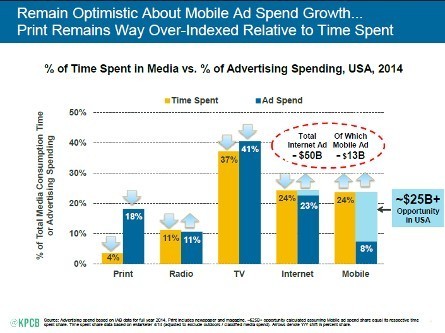
While the growth in mobile phone use has been epic in recent years, advertising spending hasn’t yet caught up.
The report compared the percentage of time Americans spend each time with each media form, compared to the percentage of advertising money spent on each medium.
The report found the percentage of ad spending on radio, TV and internet were roughly in line with the amount of time consumers spend with those media. For radio, both modal and ad share stands at 11%, TV’s ad share is 41% compared to 37%, while the internet claims 24% modal share and 23% ad share.
One of the big outliers in terms of ad spending is mobile. While mobile now accounts for nearly a quarter of mobile time (24%), it gets just 8% of ad spending.
The other big outlier is print. Today, it accounts for a measly 4% of media consumption time, yet claims a remarkable 18% of media ad spending.
6. The rise of mobile means more time spent on vertical screens
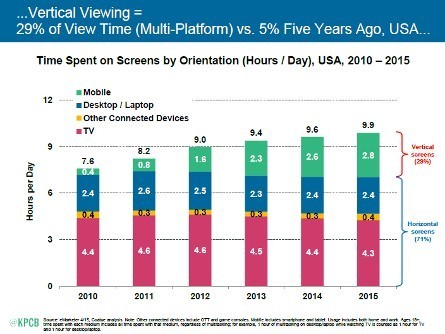
With a few notable exceptions, such as the BlackBerry Passport, most smartphone screens are held vertically while in use.
This sets them apart from computer monitors or TVs, which are typically horizontal in their orientation.
The report notes that as recently as 2010, most of the time media consumers spend staring at a screen was spent with a horizontal screen.
However, the explosion of mobile phone use means that consumers in the US now spend 29% of their time with a vertical screen, with the share of horizontal screens falling to 71%.
Do you know more on this story or have a tip of your own? Raising capital or launching a startup? . Follow StartupSmart on Facebook, Twitter, and LinkedIn.